In the U.S. in 2023, 40,901 people died due to motor vehicle fatalities. According to National Highway Traffic Safety Administration (NHTSA) data, the main causes were drunk driving, speeding, not wearing a seatbelt, and distracted driving.
Data also tells us that motor vehicle accidents are the leading cause of death for young adults aged between 19 and 21 years old. In California, the nation’s most populous state (39.2 million residents), there were 4,061 motor vehicle fatalities, 10% of the national total.
In this study, we’ll look at the extent to which wealth plays a role in car accident risk by comparing affluent and relatively poor areas in California and their associated motor vehicle fatality statistics.
We’ll also consider determining factors like traffic volume and road quality to pull together an answer to the question: does wealth play a big part in driver safety?
Income Extremities Across California
Well, research suggests that the answer is ‘yes’, with wealthy California owners of luxury and sports cars like Lamborghinis involved in comparatively more accidents, largely due to behaviors like speeding, overconfidence and risk-taking.
Yet it’s not quite that simple, with other key determining factors especially significant. Before we consider those, let’s first look at the highest and lowest earners in California.
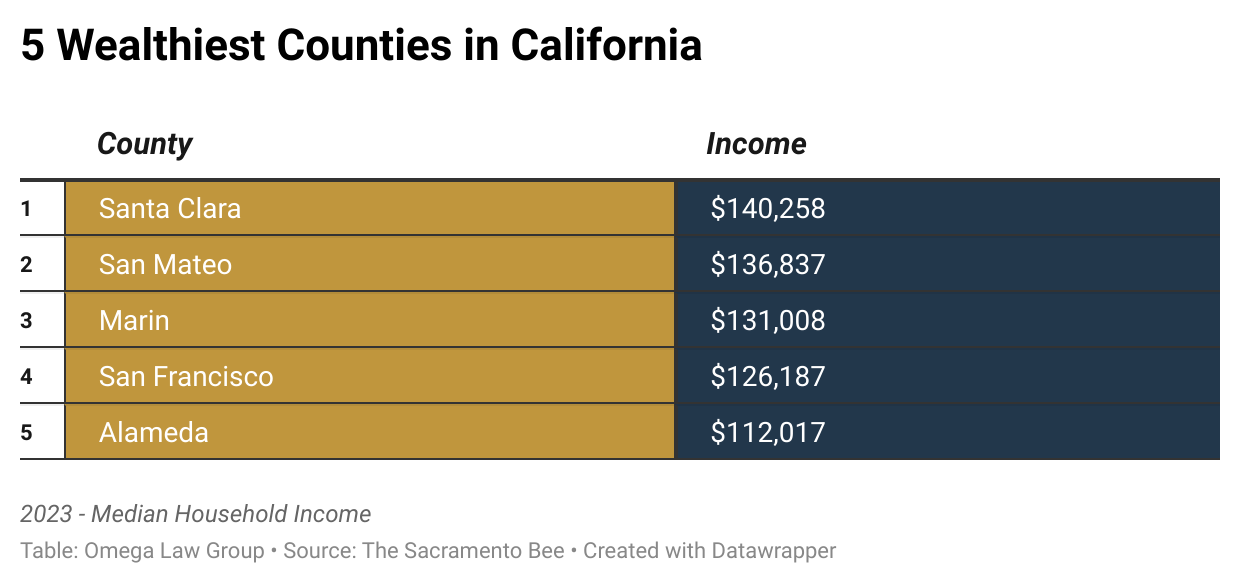
United States Census Bureau data tells us that California’s 2023 median household income ($95,521) was significantly higher than the country’s median income ($80,610). Yet the top earners in the following five counties were paid significantly higher sums.
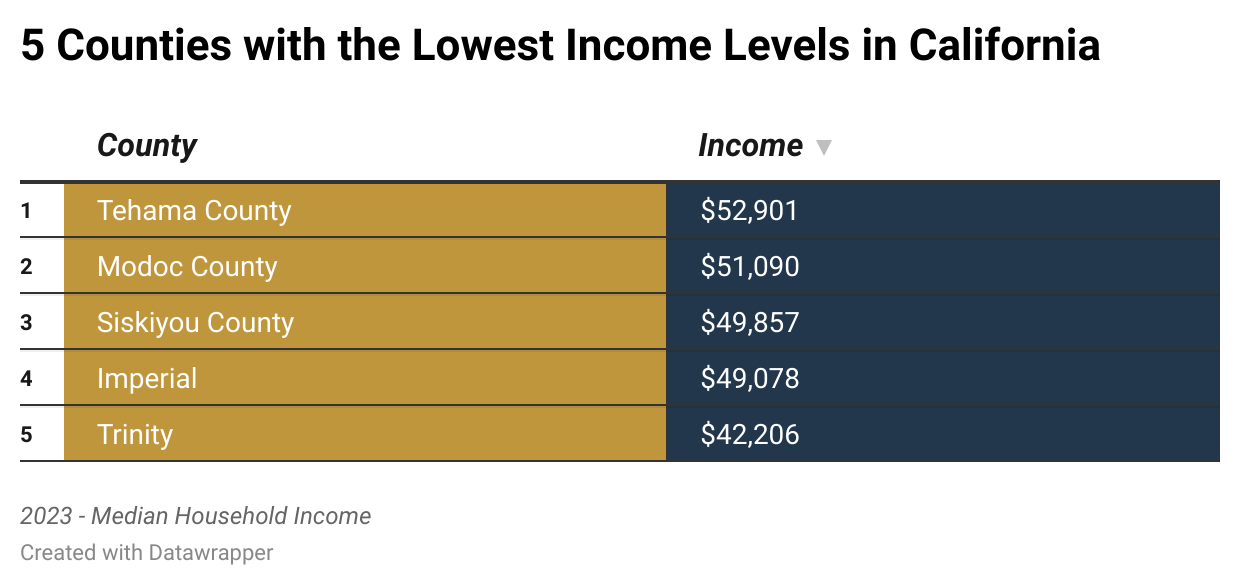
And, at the opposite end of the income scale, the following five counties comprised the earners bringing in California’s lowest pay numbers during 2023.
The data emphasizes the stark economic divide between California’s wealthiest and poorest counties. In top-earning counties Santa Clara, San Mateo, Marin, San Francisco, and Alameda, median household income ranges between $112,017 and $140,258. These figures are largely driven by residents with comparatively high education levels, proximity to tech hubs, and local access to other high-paying industries.
At the opposite end of the economic scale, Trinity, Imperial, Siskiyou, Modoc, and Tehama report median incomes between $42,206 and $52,901, less than half of Santa Clara household earnings.
These lower-income counties are predominantly rural, with economies rooted in agriculture or natural resources, and must contend with limited job opportunities, inadequate infrastructure, and far less investment.
The sharp income gap between California’s highest and lowest earners underscores the growing inequality across the state, where location heavily influences economic opportunity and quality of life. Income and location also influence motor vehicle fatality rates, as the next set of data indicates.
Motor Vehicle Fatalities in California: Rich vs. Poor
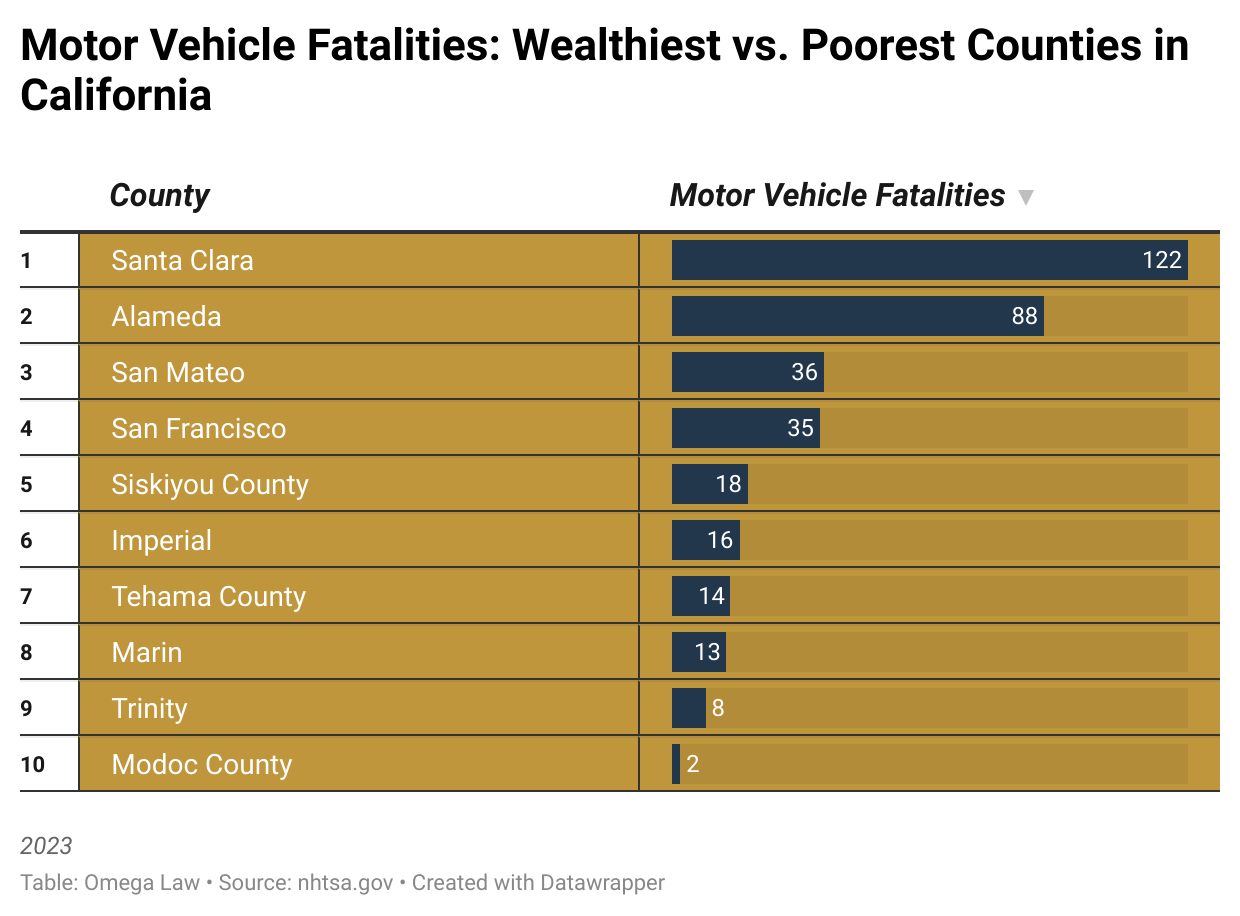
The above table reveals a striking difference between California’s wealthiest and poorest counties when it comes to motor vehicle fatalities. Yet the story is not quite as simple as it may initially appear.
The five wealthiest counties in the dataset, Santa Clara, San Mateo, Marin, San Francisco, and Alameda, with household income levels up to $140,258, cumulatively accounted for 294 motor vehicle fatalities.
On the other hand, the five poorest counties, Trinity, Imperial, Siskiyou, Modoc, and Tehama, with median household incomes up to $52,901, accounted for only 58 fatalities.
At face value, it may seem surprising that comparatively wealthy counties have suffered a higher number of traffic deaths. However, this difference can largely be attributed to population size, road usage, and vehicle density.
Wealthier counties tend to be more urbanized, with higher populations, more registered vehicles, longer commute times, and greater daily traffic volume. Combined, these factors significantly increase the likelihood of vehicle-related incidents.
In contrast, poorer counties are more rural, with smaller populations and fewer vehicles on the road. Naturally, this reduces the total number of crashes and fatalities.
That said, the lower fatality counts in these poorer counties is not due to greater road safety: rural roads are often less well-maintained, lack adequate lights or signs, and offer fewer public transportation alternatives. Additionally, residents in lower-income areas are more likely to drive older vehicles that lack advanced safety features and may also have less access to emergency medical care following a crash.
The Population Gap
When looking at the population sizes of California’s five wealthiest counties compared to its five poorest, the disparity is as significant as the comparative income gap. Santa Clara, San Mateo, Marin, San Francisco, and Alameda have a combined population of around 4.4 million residents, with Santa Clara alone pushing 2 million.
Whereas, the combined population total of the five poorest counties (Modoc, Tehama, Siskiyou, Imperial, and Trinity) is just over 312,000, with Modoc County notably home to fewer than 9,000 people. This means that California’s wealthiest counties accommodate over 14 times more people than its poorest.
Such a huge population imbalance offers key context when we consider other metrics, such as traffic fatalities, infrastructure quality, and public safety. Larger populations naturally generate higher traffic volumes, more daily commuters, and greater overall road usage, all of which increase crash probability – irrespective of financial status.
So, the main reason wealthier counties report more road fatalities is not due to comparative road safety: it’s because far more cars are on their roads. That said, when we take a closer look, there is a significant disparity when it comes to road safety.
Road Condition Disparity Between Wealthy And Low-Income Counties
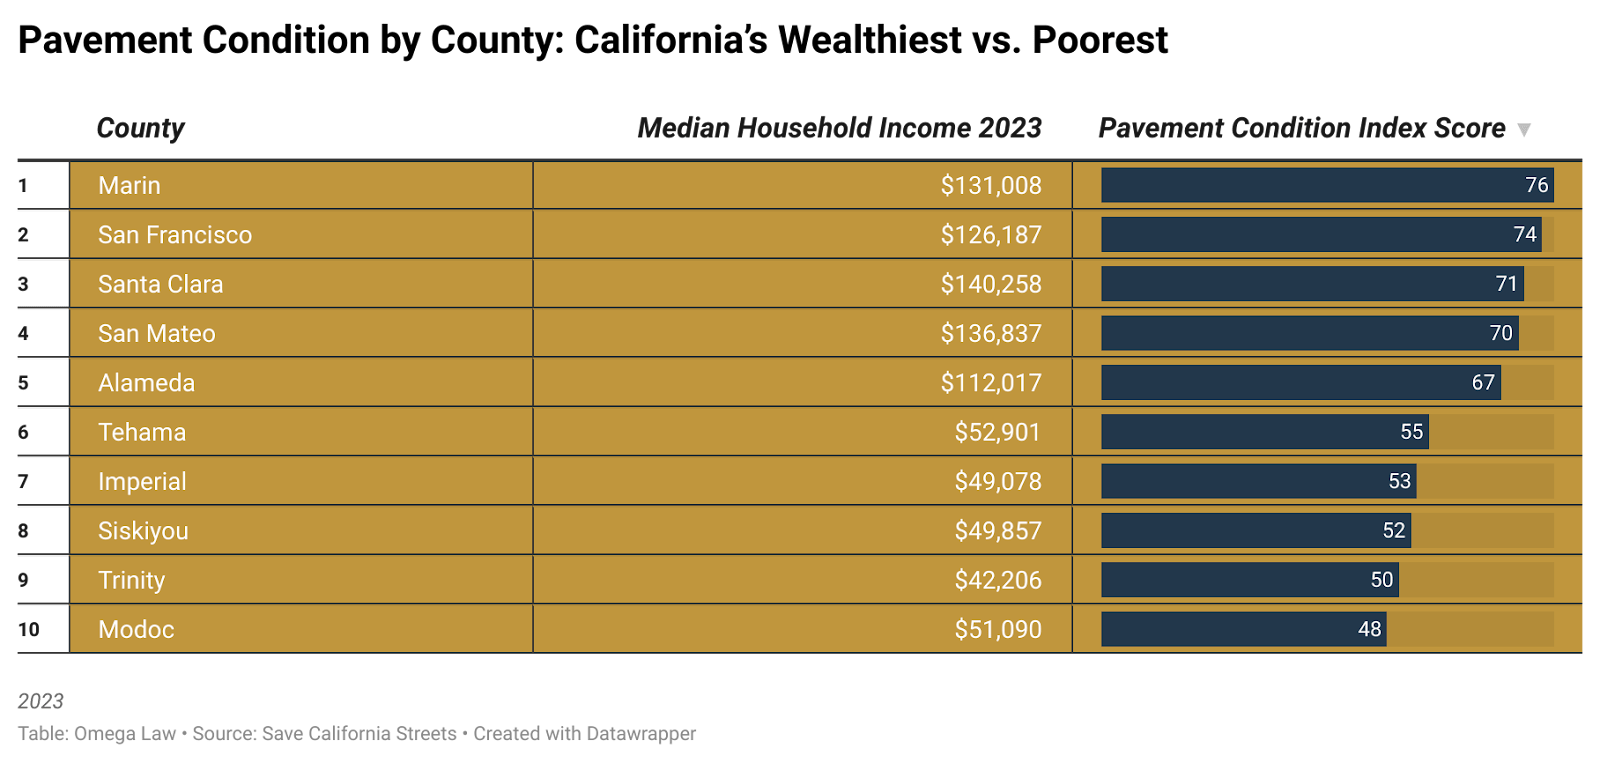
The comparatively wealthy counties in the San Francisco Bay Area under consideration (including Santa Clara and Alameda) consistently report higher pavement condition index (PIC) scores than those in the state’s rural, low-income counties.
According to the 2023 Statewide Local Streets and Roads Needs Assessment, all five of these urban Bay Area counties are categorized as either ‘Good’ (PCI 70 to 79) or ‘Fair’ (PCI 60 to 69).
For example, Alameda County holds an aggregate PCI score of around 67, while San Francisco sits near 74, and Santa Clara and San Mateo hover at 70 to 71. Scores at those levels indicate up-to-date infrastructure, smooth, well-kept roads, adequate markings, and only limited structural issues.
In contrast, drivers in the predominantly rural counties (including Trinity and Modoc) face significantly worse road conditions.
The statewide assessment reveals that most rural counties fall into ‘At-risk’ (PCI 50 to 59) or ‘Poor’ (under PCI 50) categories, ratings that signal widespread pavement distress, dangerous road cracks and potholes, and limited repair funds.
Modoc County, in particular, carries a PCI ranking that fluctuates between 46 and 56, while other counties in the dataset hover around 50 to 60, well below Bay Area averages. These ratings suggest that, despite seeing less traffic, rural roads pose a much higher risk per traveled mile.
This data highlights the infrastructure inequality between California’s wealthy urban counties and its rural, economically disadvantaged ones. Urban counties benefit from better-maintained, safer roads (thanks to larger tax bases and active pavement preservation programs) while rural counties struggle with underfunding and out-of-date infrastructure.
These disparities are crucially significant when it comes to assessing comparative road safety. They help to explain differences in accident severity and frequency, even when traffic volume is low on rural roads.
The Nuanced Role of Wealth in Car Accident Risk
Our study findings suggest that wealth does play a significant, nuanced role when it comes to car accident fatality data. At first glance, we can see that California’s wealthiest counties (Santa Clara, San Mateo, Marin, San Francisco, and Alameda) reported far more motor vehicle fatalities than the state’s poorest counties (Trinity, Modoc, Siskiyou, Imperial, and Tehama).
In total, the five wealthiest counties accounted for 294 fatalities in 2023, with the five poorest counties posting just 58 over the same year.
However, this disparity is not necessarily a reflection of unsafe driving in high-income areas. Instead, it’s largely due a much bigger population size and the number of driving miles logged.
The five wealthiest counties are collectively home to more than 4.4 million people, compared to just 312,000 across the five poorest counties, a near 14-to-1 ratio. So many more residents means far more traffic, longer commute times, and much more daily vehicle usage – all naturally increasing the likelihood of crashes.
Yet, wealth does appear to protect drivers against danger: not through driver behavior, but through better infrastructure, access, and safety features. Wealthier counties generally have higher Pavement Condition Index (PCI) scores, ranging from the high-60s to mid-70s, indicating well-maintained roads, clearer, better signs, and smoother driving conditions.
Wealthier counties tend to be more urbanized, with higher populations and greater daily traffic volume, factors that significantly increase the likelihood of vehicle–related incidents.
The wealthy counties in question also have more funding in place they can use to invest in road preservation, advanced traffic management systems, and emergency services.
On the other hand, the state’s poorest counties post low PCI scores (which sometimes fall below PCI 50) that means they’re rated as ‘at-risk’ or ‘poor’, statuses that indicate crumbling pavements, insufficient lighting, and limited safety barriers.
Such rural counties often lack the resources to fix or improve roads, while their residents are more likely to drive older, less safe vehicles; they’re also more likely to struggle with limited public transit options and inadequate medical services.
Ultimately, wealth does indirectly influence car accident risk. While affluent counties may suffer more overall crashes due to their size and density, their roads are usually much safer, better managed and more regularly maintained. Conversely, although less wealthy counties suffer fewer crashes due to traffic volumes, the condition of their roads often represents a far greater risk per mile traveled.
So, the data reveals a layered relationship between income and roadway safety, proving that infrastructure inequality and regional underinvestment are key factors when it comes to understanding car accident risk.
In short, wealth doesn’t eliminate accident potential, but it can (and does) shape a driving environment in ways that can make roads much safer.